")
Market development
Photovoltaics
PV capacity additions by segment in the EU from 2014 – 2024
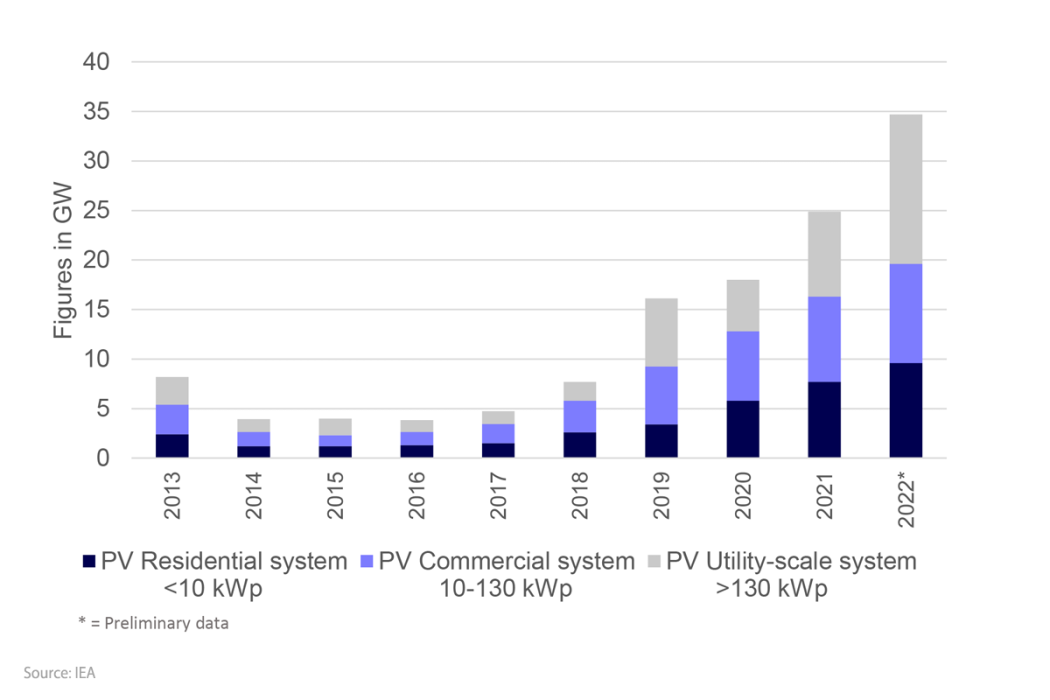
There has been continuous growth in photovoltaic installations in Europe in recent years, with exceptional expansion in 2023
Development of electricity generation from photovoltaic systems in the EU from 2013 – 2024
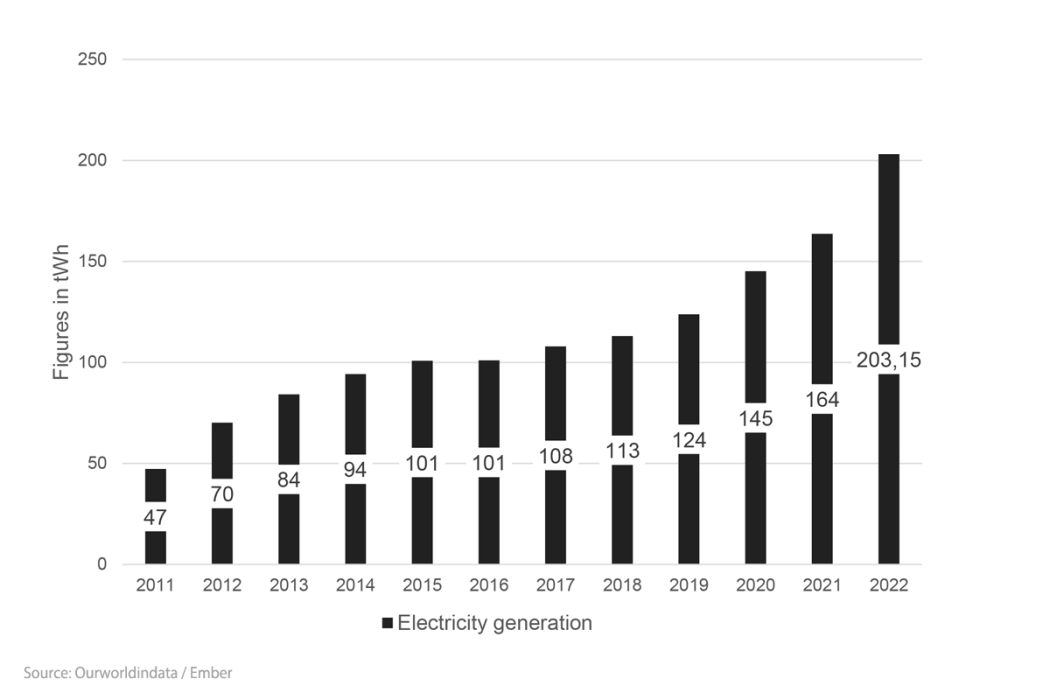
Installed PV output and the resulting solar power generation are constantly on the rise.
Electricity generation capacity of photovoltaic systems in the EU 2015 – 2024
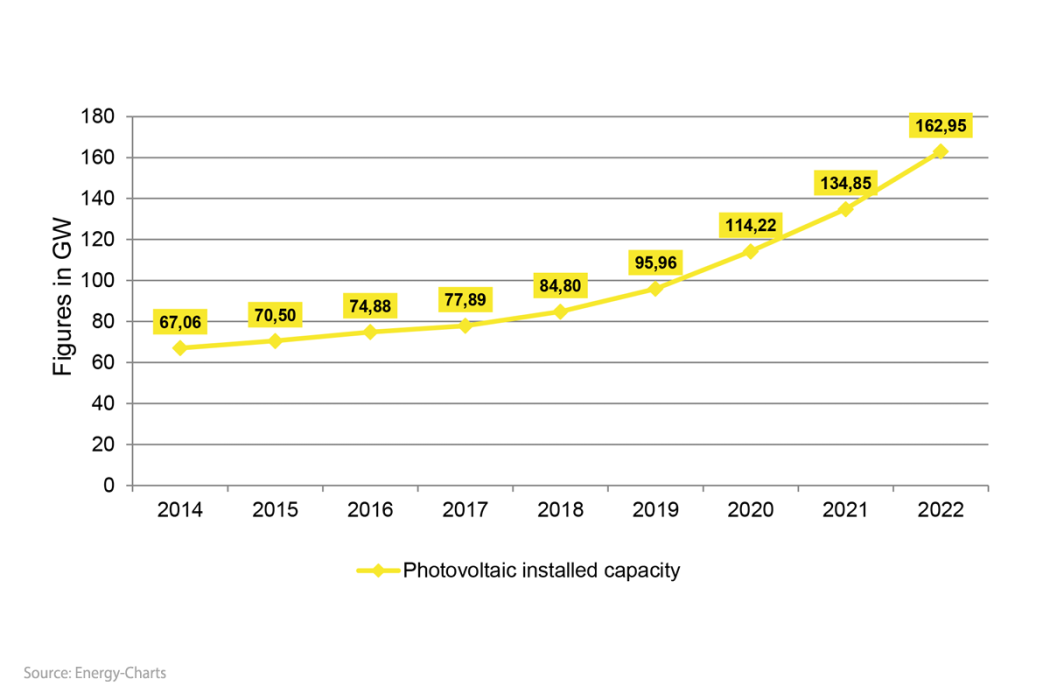
Installed PV output and the resulting solar power generation are constantly on the rise.
Theoretical PV penetration by country in 2024
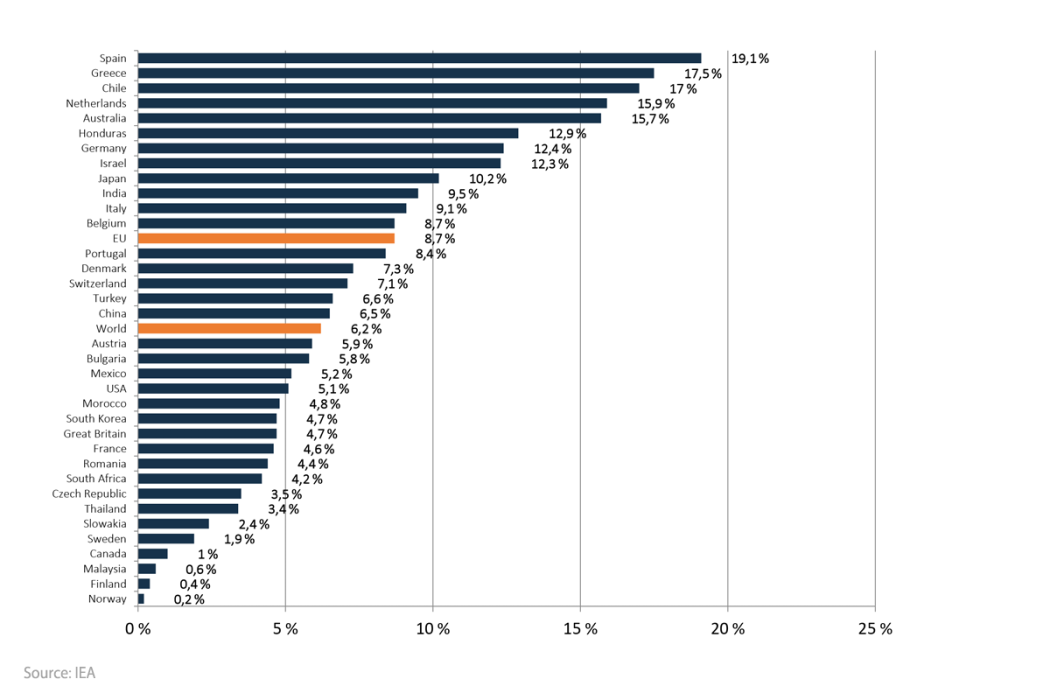
This figure shows the theoretical PV share in electricity demand in selected countries (IEA PVPS and others), based on the overall installed solar PV capacity until 2024.
Solar PV contributes 14% to the European Union electricity demand.
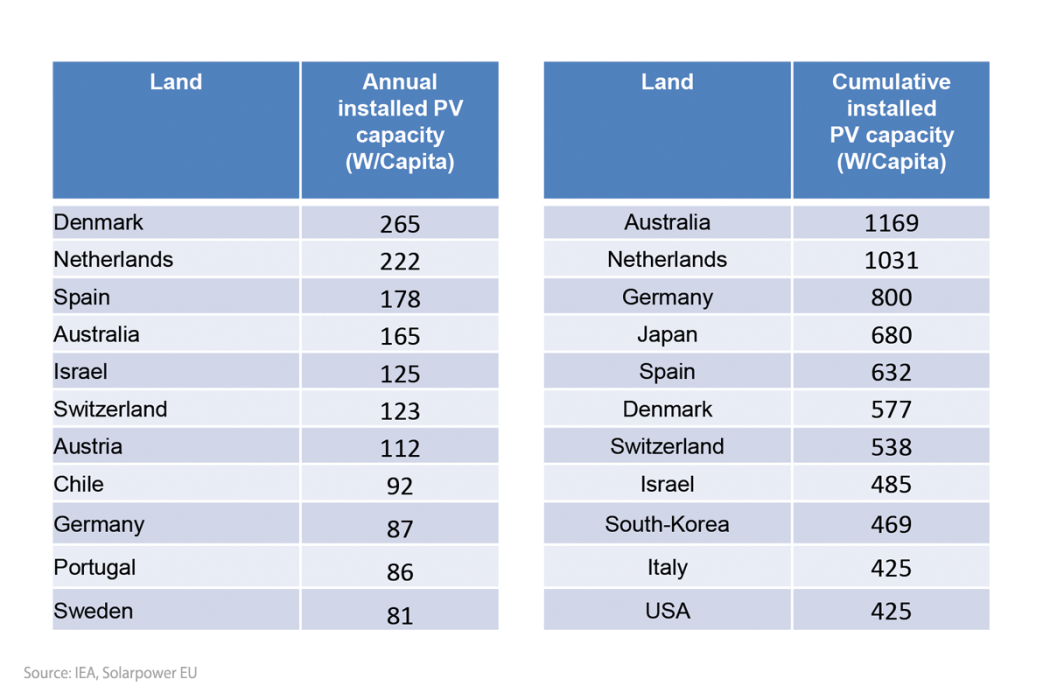
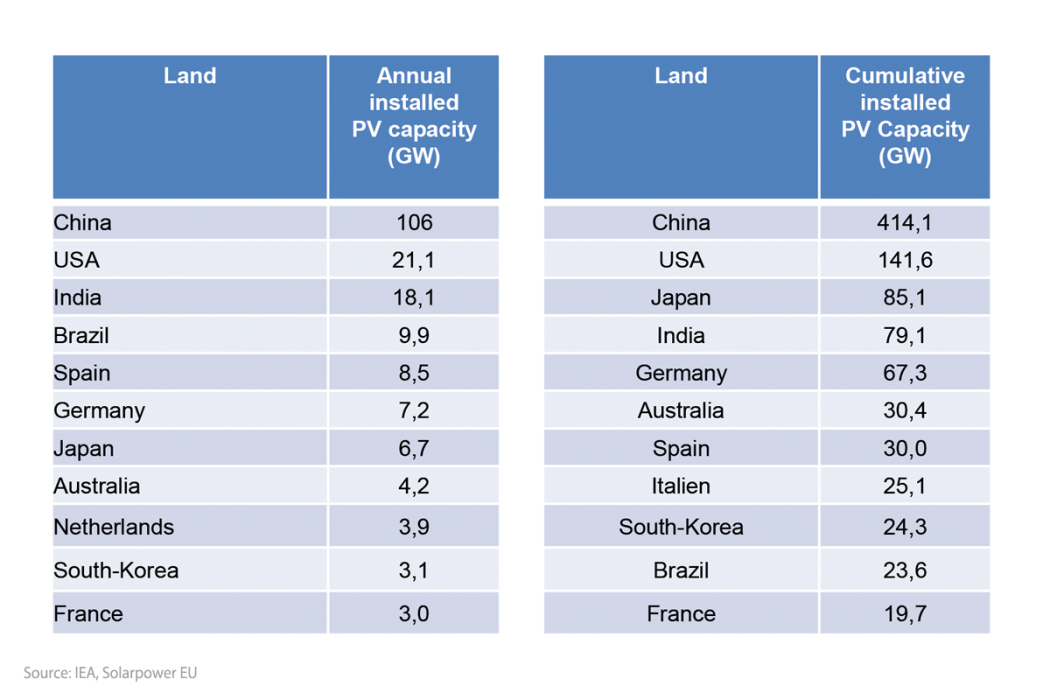
Top ten countries for annual or cumulative installed PV capacity in 2024
Top ten countries for annual or cumulative installed PV capacity per capita in 2024